

Shots
- PharmaShots ranks 20 countries on health-innovation capacity from a 35-economy pool, using five equally weighted public indicators: health spending, physician supply, R&D intensity, researcher density and clinical-trial activity (data snapshot 15 October 2026).
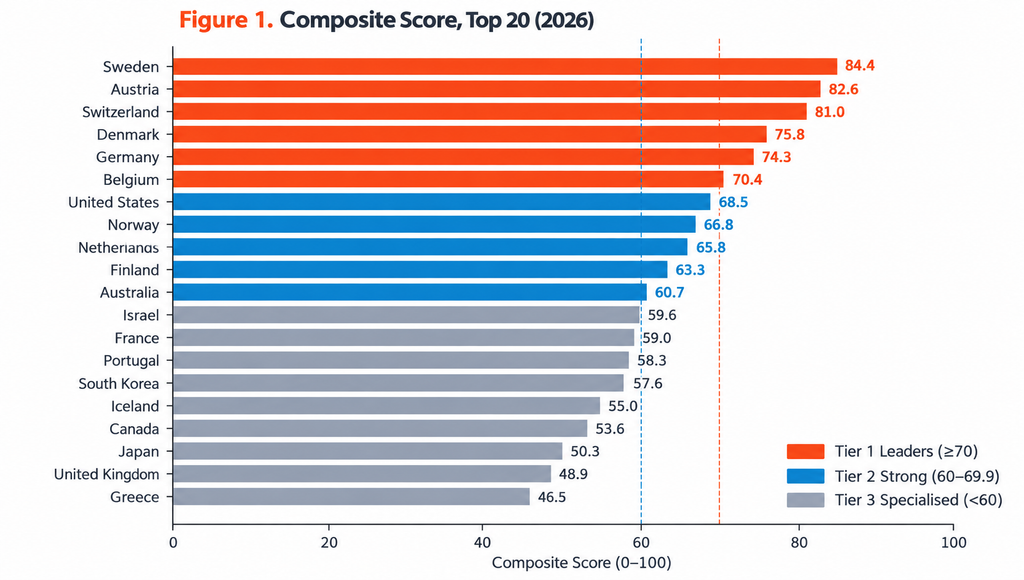
- Sweden leads with 84.4/100, followed by Austria (82.6) and Switzerland (81.0); Denmark, Germany and Belgium complete Tier 1, while the United States places 7th (68.5) because the index rewards intensity per person, not absolute scale.
- Europe holds 14 of the top 20 places, Asia-Pacific three and North America two; this edition uses a new, reproducible method and is not comparable with the 2025 PharmaShots ranking.
Executive Summary
Healthcare-innovation capacity in 2026 is concentrated in small, research-dense health systems, while the world’s largest market still dominates clinical-research scale. PharmaShots scored 35 high-income and major emerging economies on five public indicators (health spending, physician supply, R&D intensity, researcher density and clinical-trial activity). Sweden (84.4), Austria (82.6), Switzerland (81.0), Denmark (75.8) and Germany (74.3) lead the ranking; the United States places 7th (68.5) because the index measures intensity per person, not absolute scale.
The leadership is robust: Sweden ranks first under every weighting tested, and 18 to 19 of the top 20 countries stay in the top 20 under each alternative specification. Order within clusters is less certain, as ranks 11-15 sit within about 3 points of each other.
Three groups emerge. Dense-system leaders (Sweden, Switzerland, Denmark, Belgium) combine high research capacity with 118-232 recruiting studies per million people. The scale leader (United States) hosts 22,015 recruiting studies but ranks lower per person. R&D-intensive specialists (Israel, South Korea, Finland) rank lower on the composite because of lean health-system inputs, and rise sharply when only innovation indicators are counted.
The most common 2025-26 policy move is trial acceleration: Finland (30-day national decisions), Belgium, Norway, Sweden, Japan and Germany have all acted to cut time to first patient. Other themes in the latest news are national health-data infrastructure (Germany, Switzerland, Austria), AI sandboxes and deployment networks (UK, Israel, South Korea) and drug-pricing reform (US, Canada, Australia, France).
No single country leads every dimension, so portfolio and policy decisions should span all three groups rather than rely on one “winner”.
Introduction
In this 2026 edition of Healthcare Innovation Reimagined, PharmaShots examines 20 countries with strong healthcare and life-sciences innovation ecosystems, drawn from a pool of 35 high-income and major emerging economies.
The report measures national capacity for health innovation and current clinical-research activity: how much a country invests in its health system, how many clinicians and researchers it has, how intensively it spends on R&D, and how much clinical-trial activity it hosts. It is a comparative PharmaShots ranking, not an assessment of healthcare quality or patient outcomes, and it does not score commercial output such as drug approvals, exports or venture funding.
This edition replaces an earlier seven-dimension, expert-judgement version whose scores could not be reproduced from disclosed data. Every score here can be recalculated from the published data files, so rankings are not comparable with the 2025 PharmaShots edition.
The 2026 Nobel Prize in Chemistry was awarded jointly to Henri B. Kagan (France) and Kenso Soai (Japan) “for the discovery of non-linear effects and autocatalysis in asymmetric organic synthesis”.
The 2026 Nobel Prize in Physiology or Medicine was awarded jointly to Karl Deisseroth (USA), Peter Hegemann (Germany) and Georg Nagel (Germany) “for their discoveries concerning light-gated ion channels and optogenetics.”
Quantitative Analysis
Five public indicators, each carrying a 20% weight, are converted to percentile ranks within the 35-economy pool and averaged into a 0-100 composite.
Indicators and weights
| Pillar | Indicator | Source and code | Weight | Data years |
| Health-system investment | Current health expenditure, % of GDP | WHO GHED via World Bank WDI, SH.XPD.CHEX.GD.ZS | 20% | 2023-2024 |
| Clinical workforce | Physicians per 1,000 people | WHO / World Bank WDI, SH.MED.PHYS.ZS | 20% | 2017-2023 (mostly 2021-2023) |
| R&D investment | Gross domestic R&D expenditure, % of GDP | UNESCO UIS / World Bank WDI, GB.XPD.RSDV.GD.ZS | 20% | 2020-2024 (mostly 2023) |
| Research talent | Researchers in R&D per million people | UNESCO UIS / World Bank WDI, SP.POP.SCIE.RD.P6 | 20% | 2017-2023 (mostly 2023) |
| Clinical-trial activity | Mean of percentile of absolute recruiting studies and percentile of recruiting studies per million | ClinicalTrials.gov API v2 (status RECRUITING); population from WDI SP.POP.TOTL (2025) | 20% (10% + 10%) | Live count, 15 Oct 2026 |
Ranking Methodology
The composite is a simple, reproducible percentile average of five public indicators; every score can be recalculated from the published data files.
- Universe: 35 economies (OECD high-income members plus China, India, Brazil, Singapore, Israel, Croatia and others), chosen editorially: 24 European, 7 Asia-Pacific, 2 North American, 1 Middle Eastern and 1 Latin American. It is not all 193 UN member states.
- Scoring: each indicator is converted to a percentile rank (0-100) within the pool, with ties sharing the average rank.
- Composite: the simple mean of available pillar scores; missing indicators are dropped, not imputed. Australia, Israel and Brazil have no World Bank researcher-density figure and are scored on four pillars.
- Tiers: fixed score bands: Tier 1 Leaders 70.0 or above (ranks 1-6); Tier 2 Strong performers 60.0-69.9 (ranks 7-11); Tier 3 Specialised performers below 60 (ranks 12-20).
- Verification: scores were independently recalculated from the raw data file and match the published scores to within 1e-13.
- Not measured: drug approvals, pharmaceutical exports, venture funding and company headquarters, because no harmonised open dataset covers all 35 economies.

20. Greece
- Greece ranks 20th with 46.5/100 (Tier 3; GII 2026: 41st), entering the top 20 almost entirely on physician density (6.6 per 1,000, the highest in the pool); R&D intensity is its weakest pillar and it drops out of the top 20 under two of three alternative specifications
- Greece spent 8.4% of GDP on health in 2023 and 1.5% on R&D. It had 5,283 researchers per million people and 715 recruiting clinical studies, or about 69 per million
- The health minister set a target of a fully digital national health system (ESY) by mid-2026, including hospital e-prescribing, digital oncology boards and expanded EHRs; delivery is confirmed only by press reports so far
19. United Kingdom
- The UK ranks 19th with 48.9/100 (Tier 3; GII 2026: 6th), the most data-quality-sensitive result in the index: its researcher figure dates from 2017, and its industrial and regulatory strengths sit outside the five indicators
- In 2024, the UK spent 11.1% of GDP on health and 2.7% on R&D. Its researcher density was 4,473 per million people in 2017, and it had 2,816 recruiting clinical studies, or about 41 per million
- The Life Sciences Sector Plan (16 July 2025, backed by more than GBP 2B) and the 10 Year Health Plan for England (July 2025, NHS App as the ‘digital front door’ by 2028) set direction, while the MHRA runs its AI Airlock regulatory sandbox for AI as a medical device
18. Japan
- Japan ranks 18th with 50.3/100 (Tier 3; GII 2026: 12th); R&D intensity is top-decile (3.4% of GDP) but its ClinicalTrials.gov footprint is small (~10 studies per million), partly because many trials sit in the national jRCT registry
- Japan spent 10.7% of GDP on health in 2023 and had 2.6 physicians per 1,000 people. It also had 5,609 researchers per million people and 1,262 recruiting clinical studies
- Since 10 February 2026 the MHLW/PMDA ENSEMBLExJ one-stop service gives overseas sponsors priority consultation and accepts English-language submissions case by case, while MHLW advances GCP reforms including single-IRB review
17. Canada
- Canada ranks 17th with 53.6/100 (Tier 3; GII 2026: 16th), a high-volume trial market (3,512 recruiting studies, ~84 per million) held back by low physician density (2.8 per 1,000, 12th percentile) and below-median R&D intensity
- In 2024, Canada spent 11.3% of GDP on health and 1.8% on R&D. It had 5,624 researchers per million people in 2022
- Ottawa has signed national pharmacare bilateral agreements with Manitoba, British Columbia, Prince Edward Island and Yukon covering contraception and diabetes medicines, with BC coverage expected from March 2026
16. Iceland
- Iceland ranks 16th with 55.0/100 (Tier 3; GII 2026: 26th); good per-capita ratios in a very small system (about 392,000 people) make its scores statistically volatile
- In 2024, Iceland spent 9.0% of GDP on health and had 4.4 physicians per 1,000 people. R&D accounted for 2.6% of GDP, researcher density was 5,953 per million people, and the country had 26 recruiting clinical studies, or about 66 per million
- On 21 August 2026 the government confirmed its target to complete the New Landspítali hospital by 2029, and its 2027-2031 fiscal plan (1 April 2026) prioritises health, including a home-hospital programme
15. South Korea
- South Korea ranks 15th with 57.6/100 (Tier 3; GII 2026: 4th), the largest gap in the top 20 between innovation capacity and composite rank: the pool’s highest researcher density (9,472 per million) and R&D of 4.9% of GDP, offset by 2.6 physicians per 1,000 (6th percentile)
- In 2024, South Korea spent 8.7% of GDP on health and had 1,837 recruiting clinical studies, or about 36 per million people. It rises to 4th place when only innovation indicators are considered
- On 6 August 2026 the Ministry of Health and Welfare finalised its AI healthcare strategy, including a ‘Public Healthcare AI Highway’ linking 72 public hospitals by 2029
14. Portugal
- Portugal ranks 14th with 58.3/100 (Tier 3; GII 2026: 30th), driven mainly by physician density (5.9 per 1,000, 97th percentile); it is one of the two least robust top-20 members and falls to 21st under the innovation-only specification
- Portugal spent 10.2% of GDP on health in 2024 and 1.7% on R&D. It had 5,983 researchers per million people and 539 recruiting clinical studies, or about 50 per million
- The 2026-27 seasonal health response plan and government announcements of 275 new INEM emergency vehicles and 400-500 intermediate-care beds focus 2026 policy on service capacity
13. France
- France ranks 13th with 59.0/100 (Tier 3; GII 2026: 13th), a large-volume European trial market (6,016 recruiting studies, the third-largest count in the pool, ~88 per million) held back by physician density (3.3 per 1,000, 24th percentile)
- In 2024, France spent 11.5% of GDP on health and 2.2% on R&D. It had 5,369 researchers per million people
- The 2026 social security financing law (LFSS 2026, Law 2025-1403 of 30 December 2025) sets the national health spending target (ONDAM) at EUR 274.4B
12. Israel
- Israel ranks 12th with 59.6/100 (Tier 3; GII 2026: 15th); it is the pool’s most R&D-intensive economy (6.3% of GDP), but low health spending (7.1% of GDP, 18th percentile) depresses its composite, and it is scored on four pillars because no researcher-density figure is available
- Israel had 3.8 physicians per 1,000 people and 1,239 recruiting clinical studies, or about 122 per million. It rises to 2nd place when only innovation indicators are considered
- The Ministry of Health and the Israel Innovation Authority launched a regulatory sandbox for autonomous AI in healthcare, with a first cohort including Pulsenmore, Cordio Medical and Simahook; the launch date is not yet confirmed
11. Australia
- Australia ranks 11th with 60.7/100 (Tier 2; GII 2026: 20th), a solid clinical market whose rank carries extra uncertainty: it is scored on four pillars and its R&D figure dates from 2021
- Australia spent 10.4% of GDP on health in 2023 and had 4.1 physicians per 1,000 people. R&D accounted for 1.9% of GDP in 2021, and the country had 1,804 recruiting clinical studies, or about 65 per million
- The maximum general PBS co-payment fell from A$31.60 to A$25 on 1 January 2026, and bulk-billing incentives were extended to all Australians from 1 November 2025
10. Finland
- Finland ranks 10th with 63.3/100 (Tier 2; GII 2026: 8th), combining deep research talent (8,315 researchers per million, 87th percentile) and R&D of 3.1% of GDP with small absolute trial volume (441 recruiting studies, ~78 per million)
- Finland spent 10.5% of GDP on health in 2023 and had 3.6 physicians per 1,000 people in 2021
- From 11 February 2026 a fast-track review by Fimea and the national ethics committee Tukija allows decisions on national clinical trials within 30 days, and the FinTrials coordination model, with up to EUR 2M in grants, is being rolled out in 2026-27
9. Netherlands
- The Netherlands ranks 9th with 65.8/100 (Tier 2; GII 2026: 7th), a balanced mid-table performer with an above-median trial network (1,809 recruiting studies, ~100 per million) whose main constraint is workforce (3.9 physicians per 1,000, 56th percentile)
- In 2024, the Netherlands spent 10.0% of GDP on health, while R&D accounted for 2.3% of GDP. It had 6,563 researchers per million people, and its rank remained between 8th and 9th across alternative scoring methods
- On 8 September 2025 government and sector parties signed the supplementary care and welfare agreement (AZWA), which aims to reduce the projected care-workforce shortage by 100,000 by 2028
8. Norway
- Norway ranks 8th with 66.8/100 (Tier 2; GII 2026: 21st), combining high physician density (5.0 per 1,000, 91st percentile) and researcher density (7,451 per million) with comparatively low R&D intensity (1.9% of GDP, its weakest pillar)
- Norway spent 9.4% of GDP on health in 2023 and had 677 recruiting clinical studies, or about 121 per million people. This was the fourth-highest rate in Europe, behind Denmark, Switzerland and Belgium
- On 23 March 2026 Norway launched its National Action Plan for Clinical Trials and Clinical Research 2026-2036, aiming to reach Europe’s top 3 for trials per million people and to double research effort by 2036
7. United States
- The United States ranks 7th with 68.5/100 (Tier 2; GII 2026: 3rd); it leads on scale, not intensity: 22,015 recruiting studies, more than France, Canada, Spain, Germany and the UK combined, while per-capita measures such as researchers (4,937 per million, 32nd percentile) pull the score down
- The United States spent 16.7% of GDP on health in 2023, the highest share in the pool, and had 3.7 physicians per 1,000 people. R&D accounted for 3.4% of GDP, with about 64 recruiting clinical studies per million people; its rank ranges from 5th when absolute trial numbers are used to 12th when health spending is excluded
- On 2 October 2026 CMS published the Global Benchmark for Efficient Drug Pricing (GLOBE) model in the Federal Register as part of its most-favoured-nation pricing push, following the February 2026 launch of TrumpRx.gov
6. Belgium
- Belgium ranks 6th with 70.4/100 (Tier 1, the last country above the cut-off; GII 2026: 22nd), a trial-dense, R&D-intensive system (R&D 3.3% of GDP; ~144 recruiting studies per million) with modest physician supply (3.6 per 1,000, 38th percentile)
- Belgium spent 10.8% of GDP on health in 2023. It had 5,990 researchers per million people and 1,720 recruiting clinical studies
- In August 2026 the health ministry opened a consultation on reforming the ethics review of clinical trials, with recommendations due by 30 June 2027; since January 2026 the regulator FAMHP has been speeding up assessment of single-country trials
5. Germany
- Germany ranks 5th with 74.3/100 (Tier 1; GII 2026: 11th), the most method-sensitive leader (2nd to 12th across specifications): the highest health spending in the pool’s European members (12.3% of GDP) alongside ~34 recruiting studies per million, among the weakest trial densities
- Germany had 4.5 physicians per 1,000 people, and R&D accounted for 3.2% of GDP. It had 5,926 researchers per million people and 2,874 recruiting clinical studies
- The FDZ Gesundheit research data centre went live on 9 October 2025, and opt-out transfer of electronic patient record (ePA) data for research begins in October 2026, with deliveries from mid-December 2026
4. Denmark
- Denmark ranks 4th with 75.8/100 (Tier 1; GII 2026: 9th), the pool’s clinical-trial density leader (~232 recruiting studies per million, 3.6x the US) while spending less of its GDP on health (9.4%) than any other Tier 1 country
- Denmark had 4.5 physicians per 1,000 people, while R&D accounted for 3.0% of GDP. It had 8,838 researchers per million people and 1,395 recruiting clinical studies; its rank rises to 2nd when health spending is excluded
- The 26 June 2026 summer agreement adopted a national health plan for 2027-2030 ahead of the move to 4 regions and 17 health councils in 2027, after preparatory health councils started on 1 January 2026
3. Switzerland
- Switzerland ranks 3rd with 81.0/100 (Tier 1; GII 2026: 1st), the most balanced performer: no indicator falls below the 74th percentile, and its rank holds between 3rd and 6th across all specifications
- Switzerland spent 11.7% of GDP on health in 2023 and had 4.5 physicians per 1,000 people. R&D accounted for 3.2% of GDP, and it had 6,108 researchers per million people and 1,377 recruiting clinical studies, or about 151 per million
- On 14 September 2026 the National Council voted 134-53 for a federal Electronic Health Record Act creating a centrally run opt-out dossier, with entry into force targeted for 2030; the bill now goes to the Council of States and the outcome is pending
2. Austria
- Austria ranks 2nd with 82.6/100 (Tier 1; GII 2026: 18th), driven mainly by health-system resourcing (5.5 physicians per 1,000 and health spending of 11.8% of GDP, both 94th percentile); its rank falls to 7th under the innovation-only specification
- Austria invested 3.3% of GDP in R&D and had 6,634 researchers per million people. It recorded 847 recruiting clinical studies, or about 92 per million, making clinical-trial activity its weakest pillar
- On 27 March 2026 Austria launched its health reform fund (Gesundheitsreformfonds), worth EUR 497.5-580M a year through 2030 (more than EUR 2.6B in total) for primary care, prevention and digitalisation, including the 1450 telehealth line linked to the national electronic health record ELGA
1. Sweden
- Sweden leads the 2026 ranking with 84.4/100 (Tier 1; GII 2026: 2nd) and is the only country ranked first under all four specifications, supported by 8,911 researchers per million (97th percentile) and R&D of 3.6% of GDP (94th percentile)
- Sweden spent 11.2% of GDP on health in 2024 and had 4.4 physicians per 1,000 people in 2021. It recorded 1,249 recruiting clinical studies, or about 118 per million, with trial volume its weakest pillar at the 69th percentile
- The government’s 2026 instructions to the Medical Products Agency and the Swedish Ethical Review Authority call for faster clinical-trial approvals under the national life-science strategy, and a March 2026 committee directive (Dir. 2026:23) opened an inquiry into state responsibility for medicines and vaccines
Criteria and Sources
Countries are included if they sit in the 35-economy pool and rank in the top 20 on the equal-weighted five-indicator composite; all data were pulled on 15 October 2026 and URLs were accessed the same day.
- Health expenditure: current health expenditure, % of GDP, WHO Global Health Expenditure Database via World Bank WDI.
- Physicians: medical doctors per 1,000 people, WHO / World Bank WDI.
- R&D expenditure: gross domestic R&D expenditure, % of GDP, UNESCO UIS / World Bank WDI.
- Researcher density: researchers in R&D per million people (full-time equivalent), UNESCO UIS / World Bank WDI.
- Clinical-trial activity: ClinicalTrials.gov studies with status RECRUITING and at least one site in the country, absolute and per million people (World Bank 2025 population).
- Benchmark (not scored): WIPO Global Innovation Index 2026.
Core data sources
- WHO International Clinical Trials Registry Platform (registry-coverage caveat)
Prepared by PharmaShots Strategic Analysis. Not investment advice. Scores reflect the data snapshot dated 15 October 2026.